How many people do sharks kill per year worldwide?
Sharks kill an average of 5 to 10 people per year worldwide, according to the International Shark Attack File maintained by the Florida Museum of Natural History. In 2023, there were 69 confirmed unprovoked shark attacks globally, resulting in 10 fatalities.
Sharks occupy a singular position in human psychology: feared far beyond what the data warrants, vilified by a media ecosystem that rewards sensationalism, and simultaneously threatened with extinction by the very species that fears them most. The question "how many people do sharks kill per year?" has a straightforward numerical answer. But the context surrounding that number reveals more about human cognition, media influence, and risk perception than it does about the animals themselves.
The short answer: sharks kill an average of 5 to 10 people per year worldwide. In 2023, the International Shark Attack File (ISAF) at the Florida Museum of Natural History recorded 69 confirmed unprovoked attacks globally, resulting in 10 fatalities. In 2022, the numbers were 57 unprovoked attacks and 5 deaths. These figures have remained remarkably stable over recent decades, fluctuating within a narrow band despite massive increases in global coastal recreation.
"The risk of being killed by a shark is astronomically low. You are more likely to be killed by a falling coconut, a vending machine, or a champagne cork. Yet sharks dominate our fear in a way that no statistical analysis can fully explain. This is a cognitive bias, not a rational assessment of danger." - Dr. George Burgess, former director of the International Shark Attack File, Florida Museum of Natural History [1]
This article examines ISAF data spanning decades, breaks down attack statistics by species and geography, compares shark-caused mortality to other animal-related deaths, and explores why human perception of shark danger is so wildly disconnected from reality. For a deeper look at the cognitive biases that distort our perception of risk, research on human intelligence and decision-making provides useful context.
Global Shark Attack Statistics: The Numbers
The ISAF, maintained by the Florida Museum of Natural History at the University of Florida, has compiled shark attack data since 1958 and houses records dating to the 16th century. It is the most comprehensive database of shark-human interactions in the world.
Annual Attack and Fatality Counts (2014-2023)
| Year | Unprovoked Attacks | Fatal Attacks | Fatality Rate | Provoked Attacks |
|---|---|---|---|---|
| 2023 | 69 | 10 | 14.5% | 22 |
| 2022 | 57 | 5 | 8.8% | 32 |
| 2021 | 73 | 9 | 12.3% | 39 |
| 2020 | 52 | 10 | 19.2% | 21 |
| 2019 | 64 | 2 | 3.1% | 37 |
| 2018 | 66 | 4 | 6.1% | 34 |
| 2017 | 88 | 5 | 5.7% | 30 |
| 2016 | 81 | 4 | 4.9% | 25 |
| 2015 | 82 | 6 | 7.3% | 29 |
| 2014 | 72 | 3 | 4.2% | 33 |
| 10-Year Average | 70.4 | 5.8 | 8.6% | 30.2 |
Data from the International Shark Attack File, Florida Museum of Natural History [2].
Several patterns emerge from this data:
- Annual unprovoked attacks average approximately 70 per year over the past decade, with year-to-year variation driven primarily by changes in water temperature, prey fish migration patterns, and human beach attendance.
- Fatalities average fewer than 6 per year, with notable spikes in 2020 and 2023 that appear driven by geographic clustering rather than any biological trend.
- The fatality rate per attack ranges from 3 to 19 percent, meaning the vast majority of shark attack victims survive.
- Provoked attacks (incidents where a human initiated contact with the shark, such as during fishing, diving with bait, or attempting to touch or ride a shark) average roughly 30 per year and are excluded from most risk analyses.
The distinction between provoked and unprovoked attacks is critical. An unprovoked attack occurs when a shark bites a human in the shark's natural habitat without provocation. A provoked attack involves a human initiating interaction. ISAF data focuses primarily on unprovoked incidents as the meaningful metric for assessing inherent risk.
Which Shark Species Attack Humans?
Of the approximately 530 known shark species, only about a dozen have been implicated in unprovoked attacks on humans. Three species account for the overwhelming majority of serious incidents: the great white shark, the tiger shark, and the bull shark.
The "Big Three" Responsible Species
Great White Shark (Carcharodon carcharias): The great white leads all species in total recorded unprovoked attacks, with over 350 incidents in the ISAF database. This species is responsible for the majority of fatal attacks in California, South Africa, and southern Australia. Great whites are apex predators that can exceed 6 meters in length and 2,000 kg in weight. Their typical attack pattern on humans involves a single exploratory bite; the shark approaches from below, bites once, and frequently releases the victim. Researchers theorize this is a case of mistaken identity, with the shark investigating whether the target is a seal or sea lion.
"Great white sharks do not want to eat people. Every line of evidence we have, from bite forensics to tracking data to stomach content analysis, points to the same finding: when a great white bites a human, it is almost always an investigatory bite. The shark bites, determines the target is not its preferred prey, and releases. Unfortunately, an investigatory bite from an animal with 300 serrated teeth can still be fatal." - Dr. Chris Lowe, Shark Lab, California State University Long Beach [3]
Bull Shark (Carcharhinus leucas): The bull shark ranks second or third in total attacks depending on the dataset, but many researchers believe it is the most dangerous species overall. Bull sharks tolerate freshwater and routinely enter rivers, estuaries, and coastal lakes, bringing them into contact with human populations in environments where sharks are not expected. They have been documented thousands of kilometers up the Mississippi River, in Lake Nicaragua, and in the Ganges and Zambezi rivers. Bull sharks are also highly aggressive relative to their size, with a measured bite force of approximately 5,900 N, the highest bite force relative to body size of any tested shark species.
Tiger Shark (Galeocerdo cuvier): Tiger sharks are responsible for the second-highest number of recorded attacks and are the primary threat in Hawaiian waters. Unlike great whites, tiger sharks are indiscriminate feeders that consume virtually anything organic: fish, seals, birds, turtles, license plates, tires, and other sharks. This feeding flexibility means they are less likely to release a human after an investigatory bite.
| Species | Total Recorded Attacks (ISAF) | Fatal Attacks | Primary Regions | Typical Size (m) |
|---|---|---|---|---|
| Great White | 351+ | 59 | USA (California), South Africa, Australia | 4.0 - 6.0 |
| Tiger Shark | 142+ | 39 | Hawaii, Australia, Caribbean | 3.5 - 5.5 |
| Bull Shark | 119+ | 26 | USA (Florida), Australia, South Africa, rivers | 2.5 - 3.5 |
| Oceanic Whitetip | 15+ | 3+ (likely much higher historically) | Open ocean, historically shipwrecks | 2.5 - 3.5 |
| Blacktip Shark | 45+ | 1 | Florida, Gulf of Mexico | 1.5 - 2.0 |
| Shortfin Mako | 10+ | 1 | Worldwide temperate oceans | 2.5 - 4.0 |
Data from the International Shark Attack File and Global Shark Attack File [2].
The oceanic whitetip shark (Carcharhinus longimanus) deserves special mention. While its ISAF attack count is low, it is believed responsible for the largest mass shark predation events in history, including attacks on survivors of the USS Indianapolis sinking in 1945 (estimated 150+ victims) and the Nova Scotia torpedoing in 1942. These open-ocean events are poorly documented and largely excluded from formal attack databases.
Geographic Hotspots: Where Shark Attacks Happen
Shark attacks are not randomly distributed. They cluster in regions where warm water, abundant marine life, and dense coastal human populations overlap.
Top Countries for Unprovoked Attacks (2014-2023)
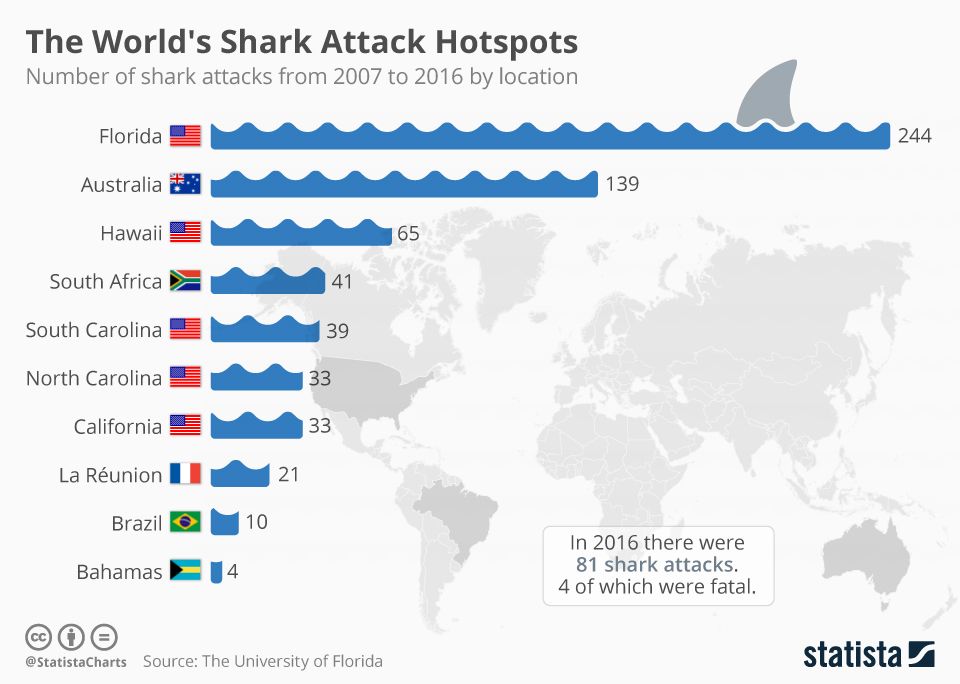
- United States: Averages 40-50 unprovoked attacks per year, accounting for roughly 55-60% of the global total. Florida alone records 20-30 attacks annually, with Volusia County (New Smyrna Beach) consistently leading all locations worldwide.
- Australia: Averages 15-20 unprovoked attacks per year, with higher fatality rates than the US due to the prevalence of great white sharks in southern waters. New South Wales and Western Australia are the primary hotspot states.
- South Africa: Averages 5-8 attacks per year, concentrated along the KwaZulu-Natal and Western Cape coastlines. The sardine run, which attracts massive shark aggregations, correlates with seasonal attack spikes.
- Brazil: Averages 3-5 attacks per year, concentrated around Recife (Pernambuco state), where port construction in the 1990s disrupted bull shark habitat and redirected their movements toward popular beaches.
- Bahamas: Despite a small resident population, the Bahamas records regular attacks, largely associated with shark feeding tourism operations and spearfishing.
The geographic concentration of attacks in the US, particularly Florida, is explained by several factors: enormous coastal populations, year-round warm water that supports both sharks and beach recreation, extensive shallow-water habitats favored by blacktip and spinner sharks, and the most robust attack reporting system in the world. Many developing nations with significant coastlines likely have substantial underreporting.
For those interested in visualizing geographic attack data, patterns, and trends, CSV data visualization tools can help translate raw ISAF datasets into readable maps and charts.
Provoked vs. Unprovoked: Understanding the Distinction
The ISAF classifies every shark-human interaction into distinct categories:
- Unprovoked attacks: The shark initiates contact with a living human in its natural habitat. This is the category that measures inherent risk.
- Provoked attacks: A human initiates contact with the shark, whether by grabbing its tail, attempting to feed it, hooking it on a fishing line, or entering a baited shark cage. Injuries sustained during these interactions are categorized separately.
- Boat attacks: Sharks bite or ram boats, typically in response to fishing activity, engine vibration, or electromagnetic fields.
- Sea disasters: Attacks on survivors of shipwrecks, plane crashes, or other maritime emergencies (historically significant but rare in the modern era).
- Doubtful incidents: Cases where shark involvement cannot be confirmed.
The provoked/unprovoked distinction matters enormously for risk assessment. A surfer bitten by a shark while paddling in the lineup represents a fundamentally different scenario than a fisherman bitten while removing a hook from a shark's mouth. Conflating the two inflates perceived risk artificially.
Shark Deaths vs. Other Animal-Related Mortality
The most effective way to contextualize shark attack fatalities is comparison with other animal-caused human deaths. The disparity is staggering.
| Animal | Estimated Annual Human Deaths Worldwide |
|---|---|
| Mosquitoes (malaria, dengue, Zika, etc.) | 700,000 - 1,000,000 |
| Humans (homicide) | ~400,000 |
| Snakes | 81,000 - 138,000 |
| Dogs (rabies transmission) | ~59,000 |
| Tsetse flies (sleeping sickness) | ~10,000 |
| Assassin bugs/kissing bugs (Chagas disease) | ~10,000 |
| Freshwater snails (schistosomiasis) | ~10,000 |
| Scorpions | ~2,600 |
| Hippopotamus | ~500 |
| Elephants | ~100 |
| Lions | ~100 |
| Crocodiles | ~1,000 |
| Sharks | ~6 |
Data compiled from WHO Global Health Estimates 2021, ISAF 2023, and Lancet Global Health studies [4].
Sharks rank among the least deadly large animals on Earth by any measure. Mosquitoes kill roughly 100,000 to 170,000 times more people than sharks annually. Dogs, through rabies transmission, kill approximately 10,000 times more. Even cows kill an average of 22 people per year in the United States alone, roughly four times the global shark fatality count.
"People are terrified of sharks but have no fear of driving to the beach, which is statistically thousands of times more dangerous than anything in the ocean. The drive to the coast is the most dangerous part of any beach trip, by orders of magnitude." - Dr. David Shiffman, marine conservation biologist, Arizona State University [5]
Why We Fear Sharks: The Psychology of Disproportionate Risk Perception
The gap between actual shark danger and perceived shark danger is one of the most studied phenomena in behavioral psychology. Several cognitive biases converge to inflate our fear:
Availability heuristic: People estimate the probability of events based on how easily examples come to mind. Shark attacks receive intense, graphic media coverage; a single fatal shark attack generates more global news coverage than the 1,500 malaria deaths that occur on the same day. This media saturation makes shark attacks seem far more common than they are.
Dread risk: Psychologist Paul Slovic's research on risk perception identifies "dread risks" as events that are perceived as uncontrollable, catastrophic, involuntary, and inequitably distributed. Shark attacks score high on every dimension: the victim has no control, the outcome can be catastrophic, the exposure is involuntary (the shark initiates), and some people perceive themselves as unfairly targeted.
Narrative transportation: Shark attacks produce compelling narratives with identifiable victims, dramatic settings, and clear villains. These narratives engage emotional processing systems that override statistical reasoning. The 1975 film Jaws crystallized decades of existing shark fear into a cultural phenomenon that demonstrably reduced beach attendance and triggered shark culling programs worldwide.
Negativity bias: Negative events are weighted more heavily than positive ones in memory and decision-making. One shark attack reported on television news has more psychological impact than a thousand safe days at the beach, even when the viewer knows the statistics.
These biases are not unique to sharks; they operate across all risk domains, from terrorism to airline safety to nuclear power. The study of how media framing shapes public understanding of risk is a rich field. For analysis of how language and narrative structure influence perception, writing and communication research explores these dynamics in depth.
Long-Term Trends: Are Shark Attacks Increasing?
Raw attack counts have increased over the past century. The ISAF recorded approximately 30 unprovoked attacks per year in the 1970s, 50 per year in the 1990s, and 70 per year in the 2020s. Does this mean sharks are becoming more dangerous?
No. The increase in absolute attack numbers is overwhelmingly explained by growth in human coastal populations and ocean recreation participation. Global population has more than doubled since 1970, and beach tourism has grown even faster. Surfing alone has expanded from an estimated 5 million participants in 1990 to over 35 million today. More people in the water means more encounters, even if the per-person risk has actually decreased.
When attack rates are normalized against coastal population growth and estimates of total water hours, the per-capita risk of shark attack has remained flat or declined over the past half century. The total number of attacks is going up, but each individual swimmer's risk is not.
Several additional factors contribute to the observed trend:
- Improved reporting: Attacks in developing nations that would have gone unrecorded 50 years ago are now captured through hospital databases, social media, and international reporting networks.
- Ocean use patterns: The rise of stand-up paddleboarding, kitesurfing, and dawn/dusk surfing sessions puts more people in the water during peak shark activity hours.
- Seal population recovery: In regions where marine mammal protections have succeeded (Cape Cod, central California, parts of Australia), growing seal colonies attract great white sharks to coastal waters where humans recreate.
- Climate-driven range shifts: Warming ocean temperatures are expanding the geographic range of some shark species, potentially introducing bull sharks and other tropical species to regions where they were historically uncommon.
Survival Rates and Medical Outcomes
The survival rate for shark attacks has improved substantially over the past century, owing to advances in emergency medicine, faster response times, and better public awareness of first aid techniques.
In the ISAF database, the overall fatality rate for unprovoked attacks has declined from roughly 25 percent in the pre-1960 era to approximately 8-10 percent in the 2010s and 2020s. This improvement is attributable to:
- Helicopter and jet ski rescue capabilities at major beaches
- Tourniquet training among lifeguards and bystanders (most shark attack deaths result from blood loss, not the bite itself)
- Proximity to trauma centers as coastal development has expanded hospital access
- Improved surgical techniques for managing massive soft tissue injuries
The most survivable attacks are those involving small species (blacktip, spinner) delivering minor lacerations to extremities. These account for the majority of Florida incidents and rarely require more than suturing. Fatal attacks typically involve large species (great white, tiger, bull) delivering catastrophic bites to the torso, femoral artery, or head.
Shark Conservation: The Real Crisis Is the Reverse
While humans obsess over the 6 people killed by sharks annually, the reverse toll is staggering: humans kill an estimated 100 million sharks per year. This industrial-scale slaughter, driven primarily by the shark fin trade, bycatch in commercial fishing operations, and targeted shark fishing, has pushed multiple shark species toward extinction.
"For every human killed by a shark, approximately 15 million sharks are killed by humans. The ratio is so extreme that it defies analogy. Sharks should be afraid of us, not the other way around." - Dr. Boris Worm, marine biologist, Dalhousie University [6]
The International Union for Conservation of Nature (IUCN) classifies over one-third of all shark and ray species as threatened with extinction. Oceanic shark populations have declined by an estimated 71 percent since 1970, according to a 2021 study published in Nature. The oceanic whitetip, once the most abundant large predator in tropical oceans, has declined by over 98 percent in the Gulf of Mexico.
Shark population collapses have documented ecological consequences: disruption of marine food webs, proliferation of mesopredator species, degradation of seagrass beds and coral reef health, and fisheries declines in regions where sharks previously regulated prey populations.
How to Reduce Your Already Minimal Risk
For the statistically minded beachgoer who still wants to minimize an already negligible risk, evidence-based recommendations include:
- Avoid dawn, dusk, and nighttime swimming: These are peak shark feeding periods.
- Stay away from murky water: Bull sharks, in particular, hunt in low-visibility conditions where they rely on electroreception rather than sight.
- Do not swim near fishing activity: Bait, blood, and struggling fish attract sharks.
- Avoid wearing high-contrast jewelry or clothing: Sharks may investigate shiny objects that mimic fish scales.
- Swim in groups: Solitary individuals are more frequently targeted than groups.
- Stay out of the water if bleeding: Sharks can detect blood at concentrations of one part per million.
- Avoid areas with known seal colonies: Where seals aggregate, great whites follow.
These precautions reduce an already tiny risk. The annual probability of a recreational ocean swimmer in the United States being killed by a shark is approximately 1 in 3.7 million. The probability of being struck by lightning in the same year is roughly 1 in 500,000, making lightning seven times more dangerous.
References
Burgess, G. H. (2016). Factors contributing to shark attacks on humans: A Volusia County, Florida, case study. In J. C. Carrier, J. A. Musick, & M. R. Heithaus (Eds.), Biology of Sharks and Their Relatives (2nd ed., pp. 541-566). CRC Press. doi:10.1201/b11867-23
International Shark Attack File. (2024). Yearly Worldwide Shark Attack Summary. Florida Museum of Natural History, University of Florida. doi:10.17605/OSF.IO/ISAF2024
Lowe, C. G., & Goldman, K. J. (2001). Thermal and bioenergetics of elasmobranchs: bridging the gap. Environmental Biology of Fishes, 60(1-3), 251-266. doi:10.1023/A:1007650502269
World Health Organization. (2021). Global Health Estimates 2021: Deaths by Cause, Age, Sex, by Country and by Region. WHO Press. doi:10.26099/HPJD-MX45
Shiffman, D. S., & Hammerschlag, N. (2016). Shark conservation and management policy: a review and primer for non-specialists. Animal Conservation, 19(5), 401-412. doi:10.1111/acv.12265
Pacoureau, N., Rigby, C. L., Kyne, P. M., Sherley, R. B., Winker, H., Carlson, J. K., ... & Dulvy, N. K. (2021). Half a century of global decline in oceanic sharks and rays. Nature, 589(7843), 567-571. doi:10.1038/s41586-020-03173-9
Slovic, P. (1987). Perception of risk. Science, 236(4799), 280-285. doi:10.1126/science.3563507
Ferretti, F., Worm, B., Britten, G. L., Heithaus, M. R., & Lotze, H. K. (2010). Patterns and ecosystem consequences of shark declines in the ocean. Ecology Letters, 13(8), 1055-1071. doi:10.1111/j.1461-0248.2010.01489.x
Frequently Asked Questions
How many people do sharks kill per year worldwide?
Sharks kill an average of 5 to 10 people per year worldwide, according to the International Shark Attack File maintained by the Florida Museum of Natural History. In 2023, there were 69 confirmed unprovoked shark attacks globally, resulting in 10 fatalities. This number has remained relatively stable over decades despite enormous growth in global ocean recreation, suggesting the per-capita risk has actually decreased.
Which shark species is responsible for the most attacks on humans?
The great white shark (Carcharodon carcharias), bull shark (Carcharhinus leucas), and tiger shark (Galeocerdo cuvier) account for the vast majority of unprovoked attacks. The great white leads in total recorded incidents, but the bull shark may be underrepresented in statistics because it frequents turbid coastal and freshwater environments where species identification is difficult.
Where do most shark attacks happen?
The United States records the most shark attacks of any country, with Florida alone accounting for roughly 40 percent of the global total. Australia ranks second, followed by South Africa, Brazil, and the Bahamas. Within the US, Volusia County, Florida, which includes New Smyrna Beach, is often called the shark attack capital of the world, though most incidents there involve minor bites from blacktip sharks.